Describe the plot

Unfortunately, this study does not work in your current browser. Please use Chrome, Firefox, or Safari. Sorry!


In this experiment, we'll ask you questions about patterns of data in a graph. The graph will only stay on the screen for 15 seconds before disappearing, so pay close attention! After the graph disappears, we'll ask you to type a description of TWO interesting comparisons or patterns that you noticed in the data - so try your best to remember at least TWO!

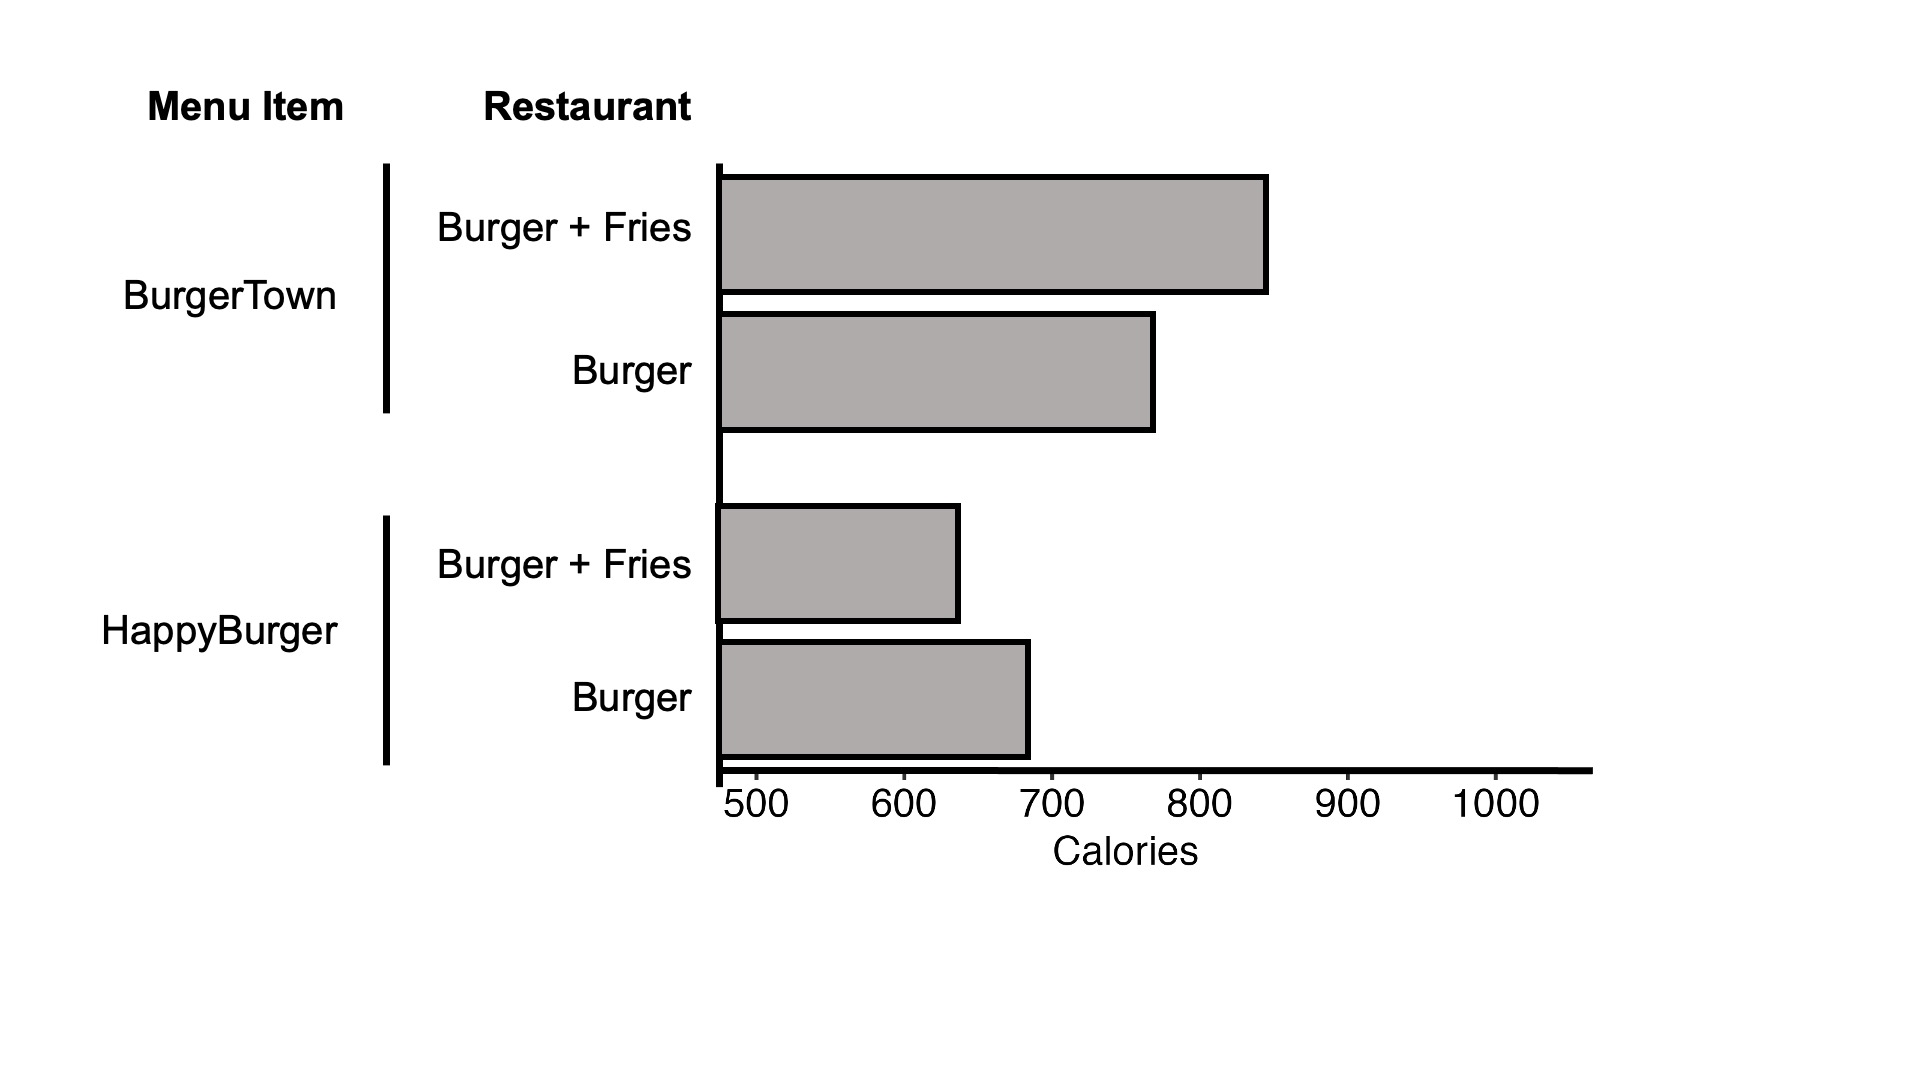
Graph background: Imagine that you are comparing the calorie counts of two meals at two burger restaurants, HappyBurger and BurgerTown. You know the calorie count for the burger and the calorie count for the burger + fries meal (the same burger as before, now with a side of fries) at both restaurants.

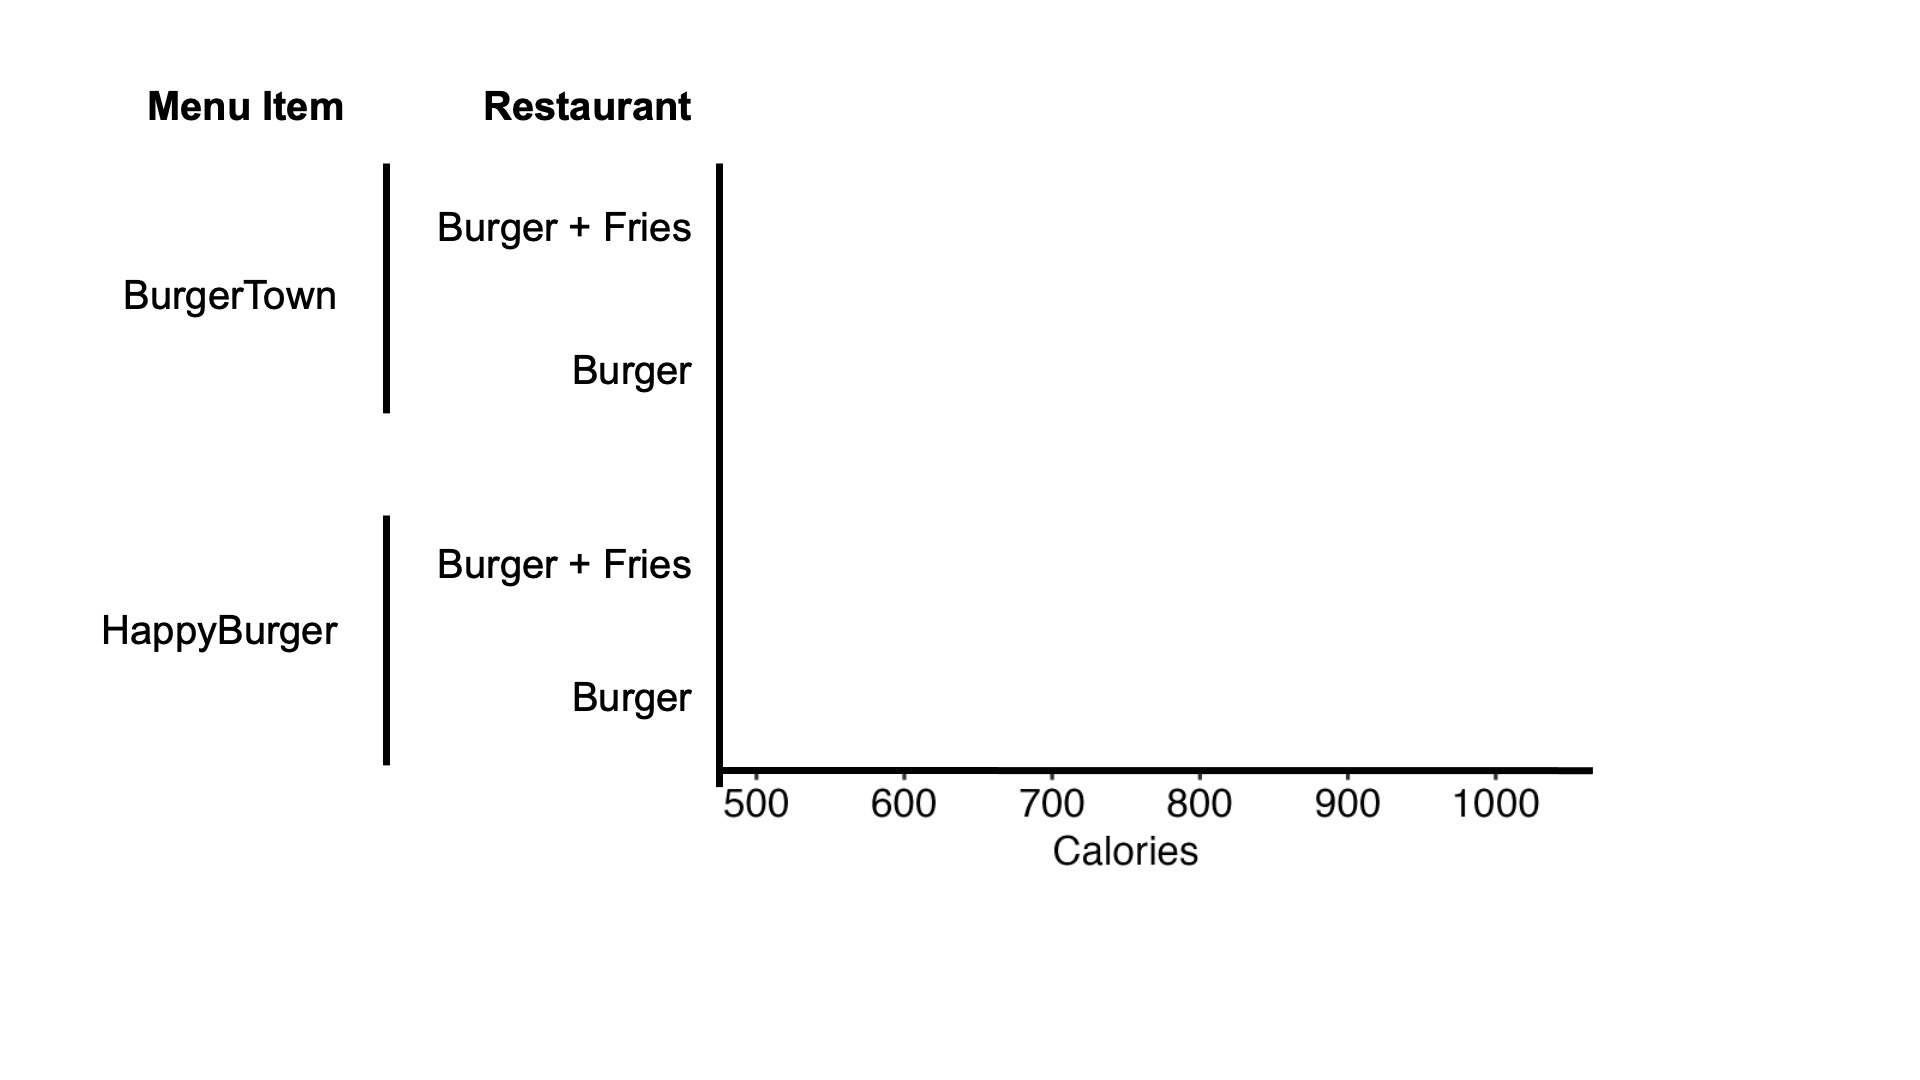
For now, only the axes are visible. When you are ready, you can reveal the data (for only 15 seconds) by pressing the right arrow key on your keyboard.

Graph disappearing in seconds.
In the text box, please describe the patterns that you see as most interesting within the graphed data (10 words minimum)

Next
You must answer the following questions before completing the experiment.

Did you notice anything that didn't make sense in the plot? (If not, simply write "no" in the box below; if yes, please describe)


Next
You must answer the following yes or no questions before completing the experiment.

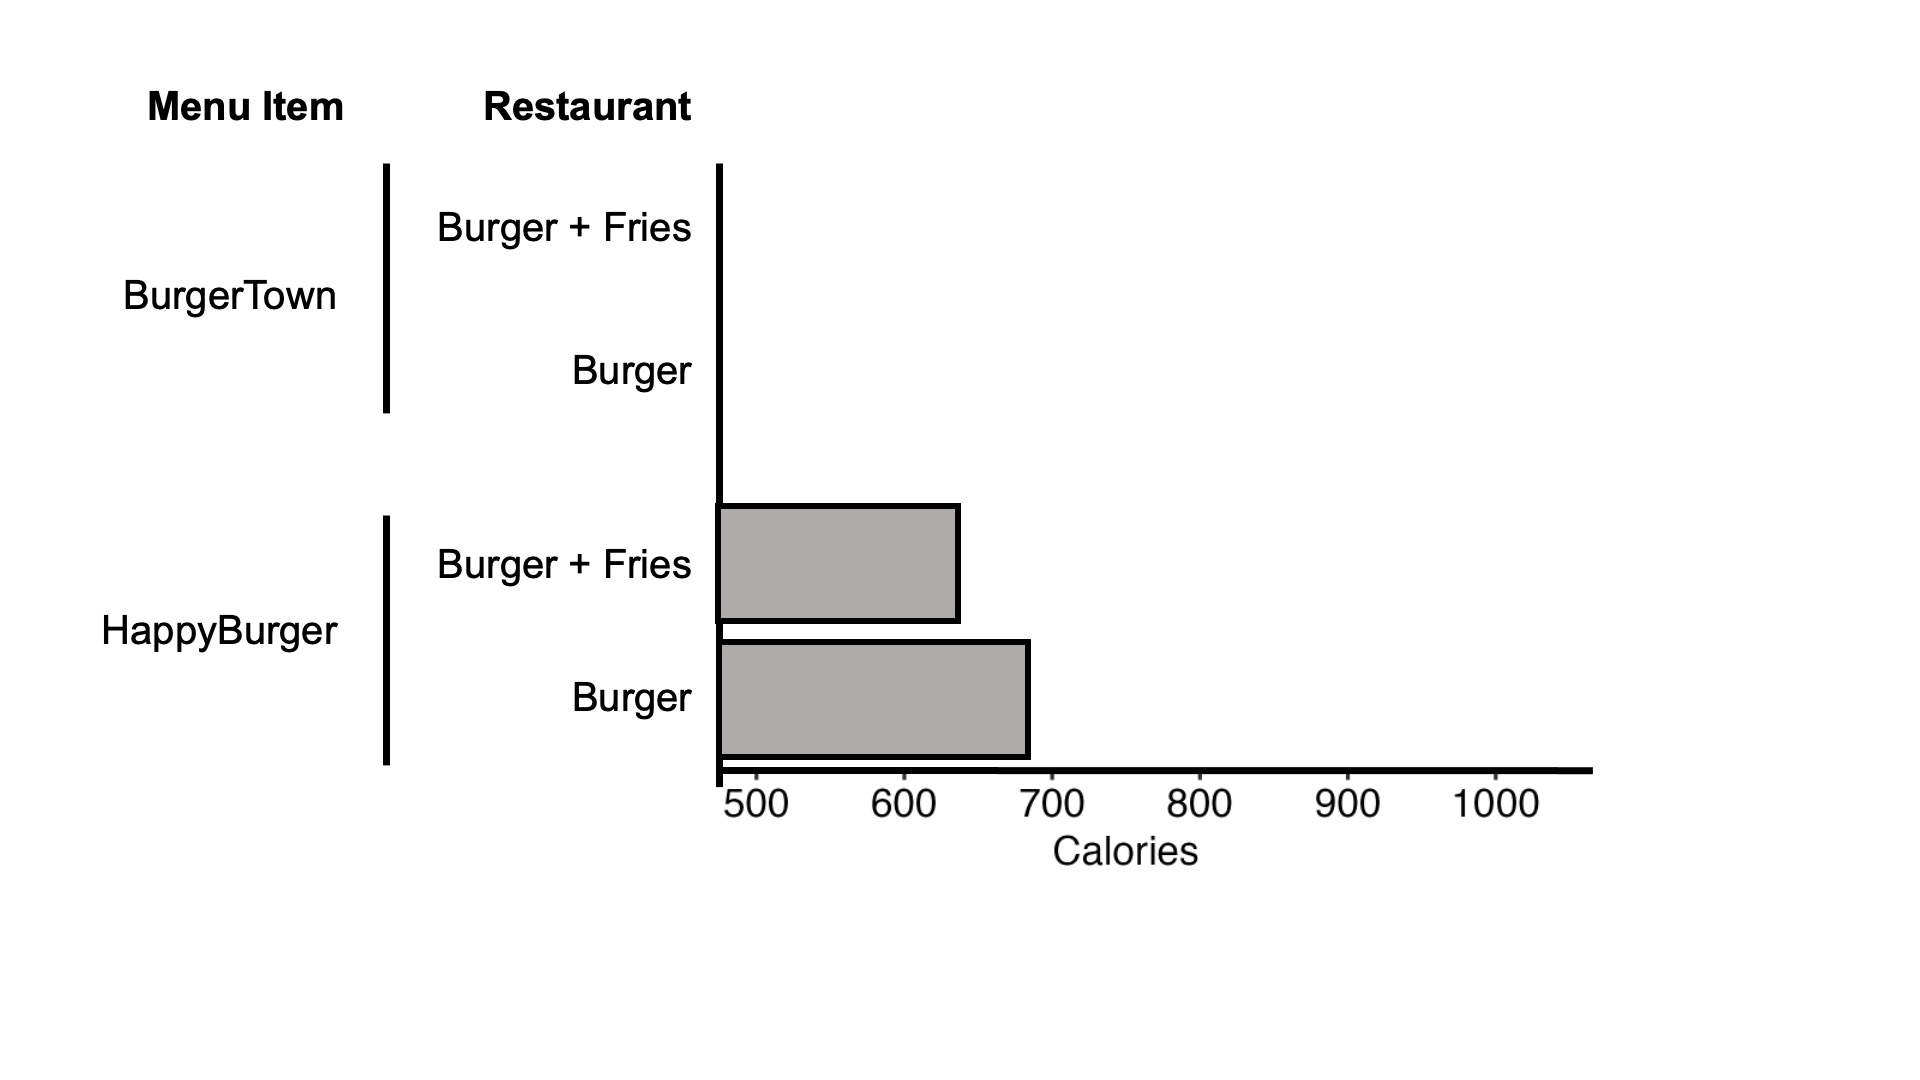
Did you previously notice that at HappyBurger, the calorie count of the Burger + Fries meal is lower than the calorie count of the Burger, which seems unlikely?

Please answer honestly! This may (or may not) be a trick question, so it is very important to us that you answer it based on what you really saw.


Yes     No
Next
You must answer the following yes or no questions before completing the experiment.

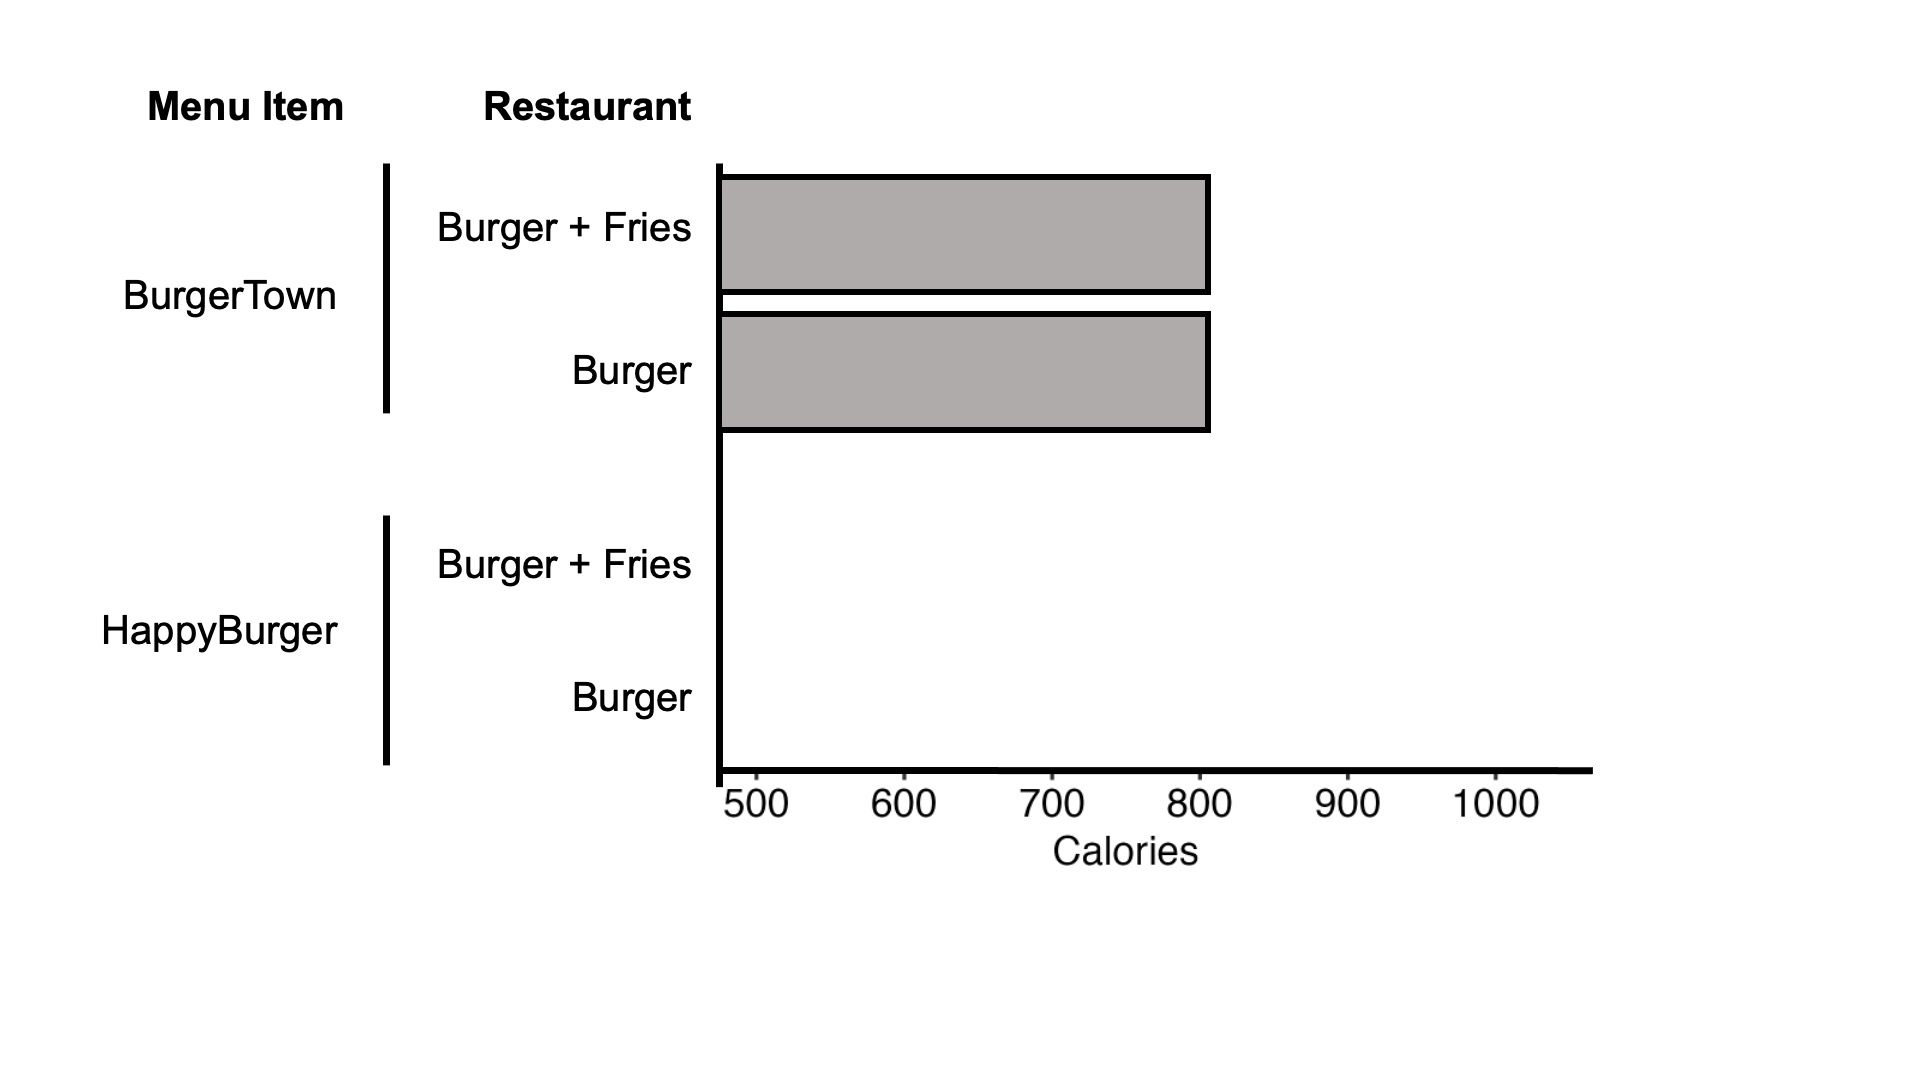
Did you previously notice that at Burgertown, the calorie count of the Burger + Fries meal is the same as the calorie count of the Burger, which seems unlikely?

Please answer honestly! This may (or may not) be a trick question, so it is very important to us that you answer it based on what you really saw.


Yes     No Next
Done! You can go ahead and submit the study using the button below after leaving a comment. You will then be redirected to Prolific. Thank you!

The purpose of this experiment was to see whether people tend to miss impossible patterns in graphs, depending on how the graphs are designed.

Please enter at least 10 words of comments/advice for us in the box below by answering some or all of the following questions.

Were the instructions clear? Were there any technical issues? Did you have any idea of what we were trying to do? Any other comments are welcome!

Once you write 10 words, a submit button will appear and you can complete the experiment!


Submit results

Your browser should automatically redirect you to Prolific's webpage where you will be given a completion code.

Redirecting in seconds.

If you're not automatically redirected in a few seconds, please copy and paste this address on your web browser: